Practise with simulated money, and see the risk you carry

Simulated orders on live prices with costs, latency and partial fills, a paper book with realised and unrealised profit and loss, and portfolio analytics from exposure to value at risk. Nothing reaches a broker.

3 of 3 available

How you work in this area

01

Place a paper order

What you see
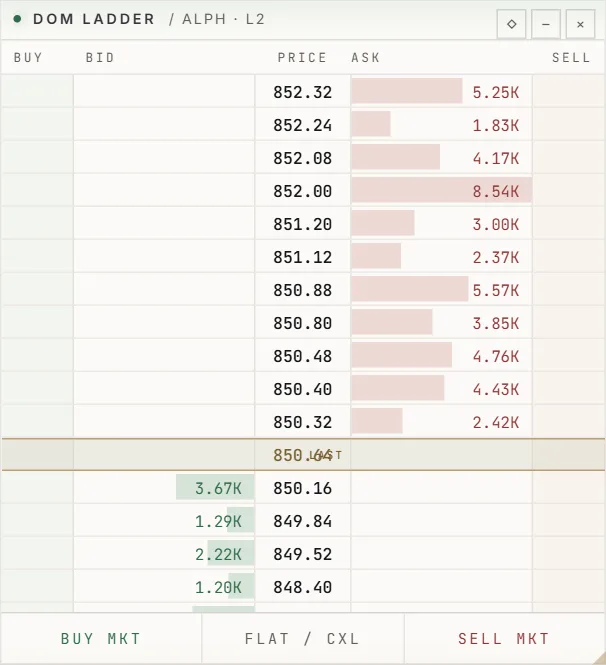
The depth-of-market ladder with bid and ask sizes at each price, and buttons to buy, flatten or sell.
What you can do
Every order, paper today, passes the same pre-trade risk checks before it reaches the book.
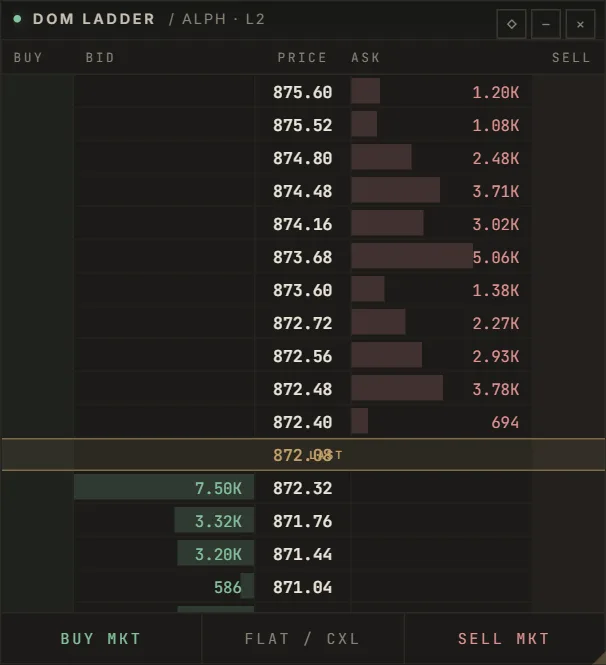
Depth-of-market ladder with bid and ask sizes at each price and buttons to buy, flatten or sellDepth-of-market ladder with bid and ask sizes at each price and buttons to buy, flatten or sell
The trading desk's depth-of-market ladder.Real captureSimPaper

02

The paper book

What you see
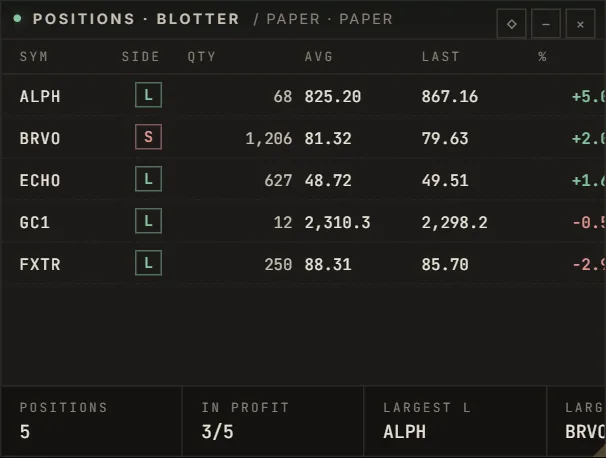
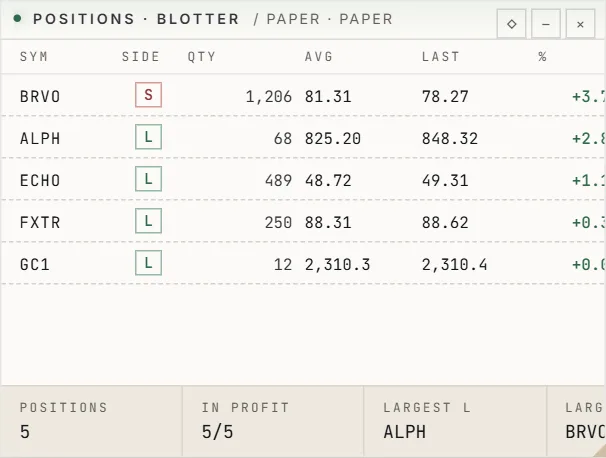
Open positions with side, size, average price, last price and change, and how many are in profit.
What you can do
Follow the paper book as prices move, position by position.
Position blotter of a paper account: symbol, long or short, quantity, average price, last price and changePosition blotter of a paper account: symbol, long or short, quantity, average price, last price and change
The position blotter of a paper account.Real captureSimPaper

03

Portfolio risk

What you see
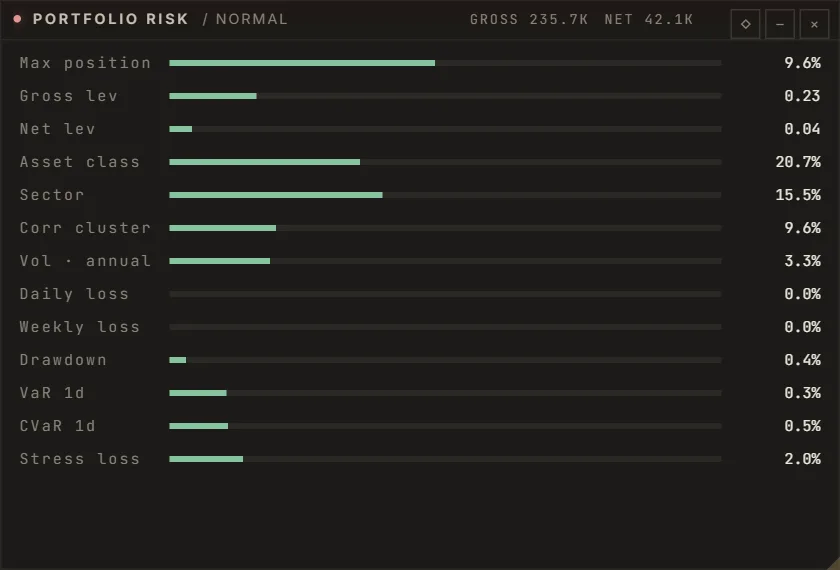
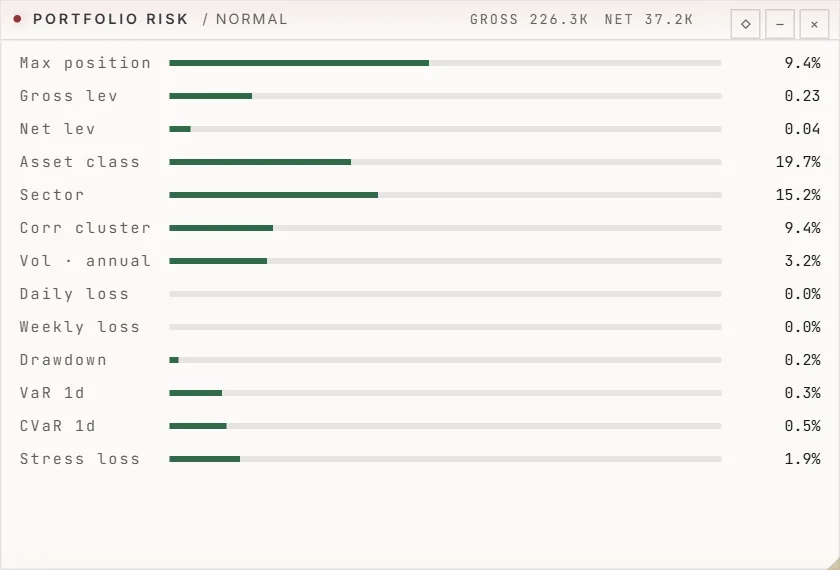
Largest position, gross and net leverage, concentration by asset class, sector and correlation cluster, volatility, loss limits, drawdown, VaR, CVaR and a stress loss.
What you can do
See how close the book is to its limits before you add to it.
Portfolio risk panel with bars for position size, leverage, concentration, volatility, loss, drawdown, VaR, CVaR and stress lossPortfolio risk panel with bars for position size, leverage, concentration, volatility, loss, drawdown, VaR, CVaR and stress loss
The portfolio risk panel of a paper account.Real captureSimPaper

04

The equity curve

What you see
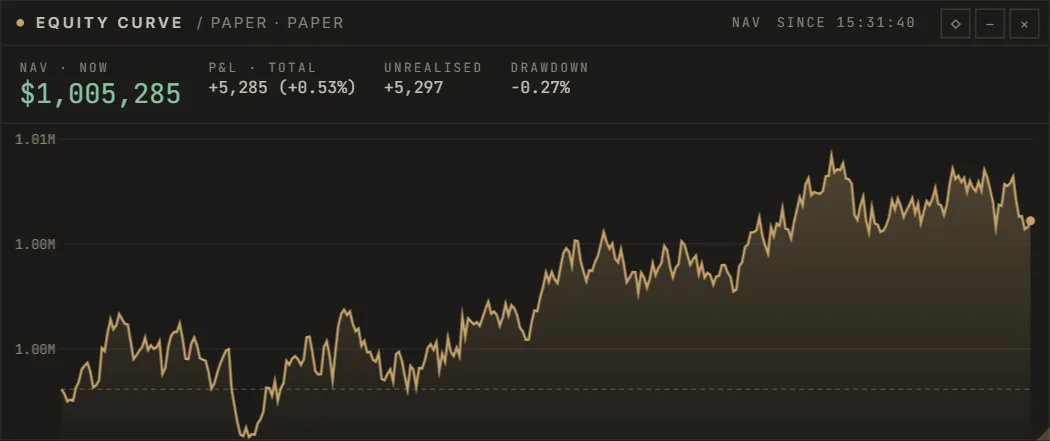
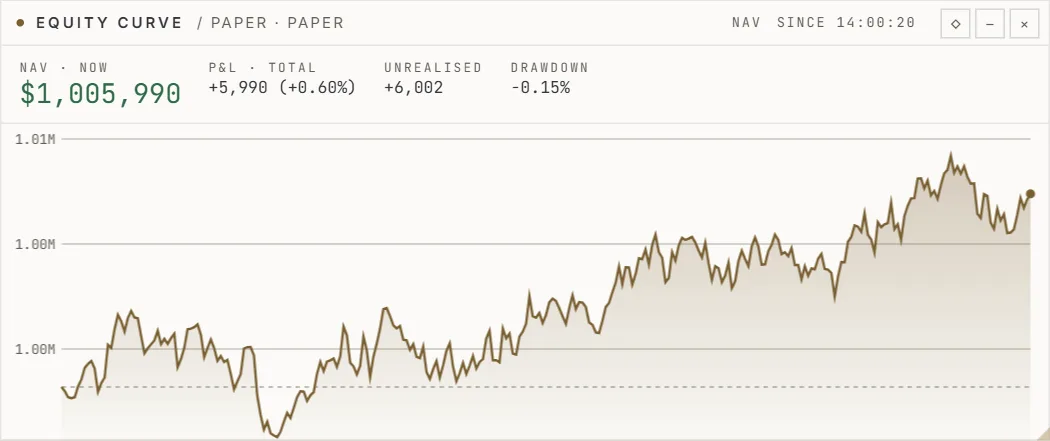
Net asset value, profit and loss and drawdown of the paper account over time.
What you can do
Compare strategy versions on their paper forward track.
Equity curve of a paper account with net asset value, profit and loss and drawdownEquity curve of a paper account with net asset value, profit and loss and drawdown
Equity curve of a paper account with simulated trades. Not a performance record.Real captureSimPaper

Every function in this area

Taken from SwiftTrade's feature register, with the plan each belongs to and its state today. Nothing is on sale yet: during the test phase SwiftTrade is free.

FunctionWhat it doesPlanStateLimit
Paper tradingSimulated orders on live prices with costs, latency and partial fills; nothing reaches a broker.FreeAvailable—
Portfolio overviewPositions, realised and unrealised P&L of the paper book.FreeAvailable—
Portfolio analyticsExposure, value at risk, expected shortfall, drawdown, correlation and concentration.ProAvailable—

What to keep in mind

SwiftTrade starts in paper mode. Live execution needs the operator's server switch and a typed confirmation for each session, and the emergency stop is always one click away.

The equity curve of a paper account is not a performance record, and simulated fills can differ from real ones.

SwiftTrade gives no investment advice and manages no money.

See it in the terminal

The terminal runs in your browser during the test phase, with paper trading and nothing to install.